Creating slippery maps
Recently, I answered a question about creating an online map of someone's fantasy world. I mentioned slippery maps which is the generic name for maps like Google Maps or MapQuest where you can drag around the map, zoom into it, and maybe set up bookmarks.
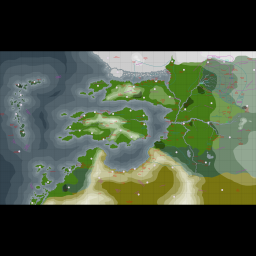
If you just want to look at the results, head over to the website.
Now, a lot of things changed since 2006 when I last created a map. Then, I needed to create some PHP code to manage it and spent better part of a week trying to jam Google Map's API into something that would work.
Today, things are a lot different and a lot easier to create something that looks good. It also doesn't require a PHP host or a database to run. But, to answer the question I gave in more detail, this is a short tutorials on how to create a slippery map of a fantasy world.
Zoom Levels and Tiles
Probably the best way to understand slippery maps is to understand zoom levels. The lowest detail, highest area is zoom zero (Z0). This represents the entire world as a single 256 pixel square tile.
A zoom level starts with zero (Z0) which represents the entire world in a single tile.
Each zoom level higher doubles the image size. So Z1 is a 512 pixel square image and Z2 is a 1,024 pixel square image. Google Maps allows up to Z18 which is an image 67,108,864 pixels on a side. At that level, we can see the driveway leading into most houses but the image requires at least 16 petabytes to load into memory at once.
I don't about you, but I'd love to have a 16 PiB RAM machine, but that isn't going to happen. Not to mention, you'd have to download all 16 PiB to actually see it.
So, to break it into smaller parts that are easier to download, display, and manage, slippery maps use 256 pixel square tiles. Each of those images are broken down into these consistent-sized tiles which are then downloaded as the library needs it.
Since we aren't using a full image, we have to know where in the bigger image we need to retrieve these images. And this introduces the coordinate system for slipper maps. The basic coordinate is a (z, x, y) where z is the zoom level. Both x and y are the zero-based index from the upper-left of the image.
Z0 would only have a single image (0, 0, 0). Z1 would have four: (1, 0, 0), (1, 0, 1), (1, 1, 0), and (1, 1, 1). Z2 would have sixteen and so on.
When a slippery map needs to retrieve the image, it maps the coordinate system into a URL of some sort. For example: http://exalted-map.mfgames.com/creation/z0/x0y0.png.
The final component of a slippery map is a layer. This can be raster data, such as satellite or a political map. It can also be vector data, such as a map of all streets in a tile. In the above example, the layer is actually creation. There is also creation-geo which is a second raster layer that doesn't have cities, geomancy, or boundaries on it.
The only limitation on how far you allow zooming or which layers is time. It does take a fair amount of time to create and manage tiles. The higher the acceptable zoom level, the more work and disk space is required to keep those tiles and to make them look good.
Starting points
Because the Javascript can't create the tiles for me, and I'm not using PHP, I need to pre-render the individual tiles at all the zoom levels I need which will then be uploaded to my website.
For me, the best place to start is with a relatively large map in Mercator project.
I'm not going to use a proper Mercator projected map since I'm going to put my Exalted Map of Creation back online and I already had most of the work done. This is a flat map without projection, so most of the coordinates are hacked to get things to work.
I decided to focus on a zoom level five for the map which requires me to start with a 8,192 pixel square. Fortunately, SVG scales very well so I have a relatively sharp image at that level.
What doesn't work is that my map of Creation isn't square. I'm cheating and just putting black bars on the top and bottom, but I highly recommend you use a properly projected map that fills the tile completely.
I do host a full version of the map on my website (there is also z0 through z4, there is also creation-geo for maps without markers). Feel free to download or use that, or even hotlink. It's there until I run out of bandwidth or something goes wrong.
The next step is to create 256 pixel square tiles from the image and give them a consistent name. Now, the tedious approach is to manually slice out each one and save it to the disk. For the larger map, that can take hours.
I happen to be lazy, I don't do tedious things like this when I can find a tool to do it for me. Fortunately ImageMagick has all the tools I need. This runs under Windows (you have to double up on the % though for the DOS command prompt) also, for those who don't use Linux.
$ convert map-z5.png -crop 256x256 -set filename:tile "x%[fx:page.x/256]y%[fx:page.y/256]" +repage +adjoin "z5/%[filename:tile].png"
$
This basically creates 1024 tile images in exalted-map/z5 where the name is xMyN.png where M and N are numbers from 0 to 31. This means that you can get a tile just from the middle by using something like exalted-map/z5/x15y15.png.
Now, if you can't guess from the above path, I'm putting all the zoom levels above five (four through zero) in the same structure.
$ convert -scale 50% map-z5.png map-z4.png
$ convert map-z4.png -crop 256x256 -set filename:tile "x%[fx:page.x/256]y%[fx:page.y/256]" +repage +adjoin "z4/%[filename:tile].png"
$
This is all in a makefile so I can just type make and have it generate all six zoom levels in a single command. Now, if you have a custom map for a different zoom level, then don't scale it from the higher level (z5 to z4). I'm only going to have the one for each layer, so I'm just scaling the entire thing from Z5.
Putting it up
Now that I have the tiles at all the zoom levels (Z0 through Z5) generated, I need to put them somewhere that can be accessed via a HTTP request. If you can't guess, I have a host at http://exalted-map.mfgames.com/.
The tiles have to have a consistent name for the slippery map to work. I decided to use the pattern:
http://exalted-map.mfgames.com/{layer}/z{zoom}/x{x}y{y}.png
At the moment, I'm allow providing two layers: creation and creation-geo.
The above URL is important for when we hook up a library to our URL, but the important part is that you can go to any image on that map and have it produce the correct results.
Creating the HTML
I decided to use OpenLayers 3 as my Javascript library. This is a pretty solid library, though there are others that can do much of the same functionality.
On the quickstart directions, they have a very basic HTML page that uses OpenLayers 3 and has the basic page. Take that HTML file and throw it up on a website (maybe at the root above the layers).
If you load the page, you should see MapQuest map. But we don't really want to see that, we want to see our own map. To do that, we change the layer:
layers: [
  new ol.layer.Tile({
    source: new ol.source.XYZ({
      layer: 'creation-geo',
      url: 'http://exalted-map.mfgames.com/creation-geo/z{z}/x{x}y{y}.png'
    })
  })
],
Refresh the page and you have a basic slippery map.
Icons and Locations
Getting locations to show up in the map is a bit harder. In OpenLayers 3, there are a lot of ways of doing it and I haven't quite found a perfect way. But, a “good enough” approach uses KML and a bit of magic.
This is the basic KML file. It just lists points on a map along with their icons. If you follow the icon links, you can find the icon images, they aren't that impressive (though I did make them in Inkscape).
<kml>
  <Document>
	<name>Exalted Canon Locations</name>
    <description>Created from stephenls map data.</description>
    <Folder>
      <name>Locations</name>
      <description>Locations</description>

      <Style id="style-canon-gate">
        <IconStyle>
          <scale>1.0</scale>
          <Icon>
            <href>http://exalted-map.mfgames.com/icons/canon-gate.png</href>
          </Icon>
        </IconStyle>
      </Style>
      <Style id="style-canon">
        <IconStyle>
          <scale>1.0</scale>
          <Icon>
            <href>http://exalted-map.mfgames.com/icons/canon.png</href>
          </Icon>
        </IconStyle>
      </Style>

      <Folder>
        <name>POI</name>
        <Placemark>
		  <name>Imperial Mountain</name>
          <styleUrl>#style-canon</styleUrl>
          <Point>
            <coordinates>-20, 12</coordinates>
          </Point>
        </Placemark>
	  </Folder>

	  <Folder>
		<name>Gates</name>
		<description>Celestial Gates</description>
        <Placemark>
		  <name>Celestial Gate #10</name>
          <styleUrl>#style-canon-gate</styleUrl>
          <Point>
            <coordinates>22.7673, 8</coordinates>
          </Point>
        </Placemark>
	  </Folder>
	</Folder>
  </Document>
</kml>
I uploaded the KML file to the site under http://exalted-map.mfgames.com/canon.kml. If you can't guess, the library needs to download it to use it.
Adding the KML file to the map is pretty easy, you do it as a second layer.
var creationGeography = new ol.layer.Tile({
    source: new ol.source.XYZ({
        // attributes: Always give credits
        url: "http://exalted-map.mfgames.com/creation-geo/z{z}/x{x}y{y}.png",
    }),
});

var canonLocations = new ol.layer.Vector({
    source: new ol.source.KML({
        projection: "EPSG:3857",
        url: "canon.kml",
    }),
});

var map = new ol.Map({
    target: "map",
    layers: [creationGeography, canonLocations],
    view: new ol.View({
        center: [0, 0],
        zoom: 3,
    }),
});
You'll notice I refactored the geography stuff out into a variable to make it easier to read. I do that a lot as I'm working and puzzling through things.
When you upload and refresh, you'll see pretty icons for all of the canon locations. The reason I'm using ‘canon’ is because I had a secondary layer called ‘sepia’ for my Sepia Throne campaign. We had a tendency to create new locations, destroy cities, and we also used 108 celestial gates instead of the 56 in the canon world. (The 108 came from the 108 Stars of Destiny.)
Clickable labels
And the final part. It isn't obvious from the icons which gate it is, so it would be nice if you could click on it and get a bit more information. To do that, we are going to show a bootstrap popup of the KML name, which should be enough.
This needs three parts. The first is to add Bootstrap and jQuery to your webpage. View source at the map to find examples if you don't know how.
The second is to add a popup element in the map.
<div id="map" class="map">
    <div id="popup"></div>
</div>
And finally, a bit more Javascript.
var element = document.getElementById("popup");

var popup = new ol.Overlay({
    element: element,
    positioning: "bottom-center",
    stopEvent: false,
});

map.addOverlay(popup);

// display popup on click
map.on("click", function (evt) {
    var feature = map.forEachFeatureAtPixel(
        evt.pixel,
        function (feature, layer) {
            return feature;
        }
    );

    if (feature) {
        var geometry = feature.getGeometry();
        var coord = geometry.getCoordinates();
        popup.setPosition(coord);

        $(element).popover("destroy");
        $(element).popover({
            placement: "auto",
            html: true,
            content: feature.get("name").replace(/ /g, " "),
        });
        $(element).popover("show");
    } else {
        $(element).popover("destroy");
    }

    feature = null;
});
Conclusions
There are a few more things I'd like to do, but… it's good enough for now. If you want to see a full version, check out the source of http://exalted-map.mfgames.com/index.html and http://exalted-map.mfgames.com/map.js. That should give you a rough idea of how to do it, along with poor comments on what we're doing.
I don't like using the KML approach, but I couldn't easily figure out how to do it via JSON or creating the features manually. For some reason, ol.geom.Point wasn't working with a ol.Feature and I didn't know why. This works for now, but if I was going to add the rest of the points, I'd find a cleaner way of doing it.
The main reason I don't want to use KML is because I want to have a link to a wiki site of some sort, or maybe some additional text. These are things easily done via JSON but not KML.
Metadata
Categories:
Tags: